When a larger number of plants show clear ToBRFV symptoms and growth is slowing down, it is time to shift the normal growing strategy to support those infected plants as much as possible. Growers are experimenting with 'helping' the plant to 'live' with the virus. Some general ideas are coming forward.
Theory of energy distribution
The theory is that the virus consumes plant energy to multiplicate and that this energy is not going towards plant growth or fruit growth. This means that the energy distribution is different as compared to normal growth and fruit setting. How much energy the virus uses is not known.
For example, for a single Pepino Mosaic Virus infection, some growers report a 5-10% reduction in plant growth and tomato fruit output. It may be possible that after an initial strong increase in ToBRFV titer, the virus multiplication becomes stable and the energy consumed is lower.

Plant and fruit symptoms
When ToBRFV infection occurs, the theory is that the head of the plant will get less energy as the developing young leaves are known to be the place where Tobamovirus undergoes a high rate of multiplication and accumulation. It is suspected that this is the reason why the leaf size narrows and becomes thinner.
Some tomato varieties manage to keep on growing but in extreme situations, the head of the plant sometimes appears to 'burn' and there is no growing point anymore. Reduction of the leaf size will also directly influence the photosynthesis surface and the same for the amount of energy for the fruit production and fill. Fruits can be reduced in number and in size.
If the virus consumes 5% of the energy, this means 1 of 20 fruits cannot be produced. In practice, this seems too low. Some growers remove 1 fruit per truss of 5-6 fruits. In more affected rows the number of fruits per truss may be lower as compared to rows where the virus infection is less developed. Reducing the number of fruits per truss, or the speed of disease development can keep the plant in an overall more productive state.
In some varieties, the fruit size may be reduced. This is due to less energy. It all depends on how the plant distributes the energy that is available. Coloring of the fruits may not be energy related but on the other hand, if there is less energy available some processes in the cells may slow down, and the development of the 'color' does not happen as fast as normal.
Climate and light
Growers have good experience with adjusting the sunlight exposure by using screens or putting chalk on the roof. This reduces the extremes in light exposure and the stress may be less on the plant. For example, the water supply to the top of the plant is easier, which might lead to some plant recovery such as the leaves getting bigger.
Autumn plantings may develop more severe symptoms
Some growers have seen relatively strong ToBRFV symptoms in crops planted in autumn in the Northern Hemisphere. At this time of year, there is less daily sunlight, and with winter's short days, plant growth is supported by artificial light. An explanation may be that the artificial light does not supply enough light and energy to balance plant growth and virus development with the result being that the virus consumes more energy.
Summer (June) or later infections
The growers' experience is that a late infection, which develops 4-6 months after sowing, seems to develop with relatively minor symptoms. These infections start in June, in which there are the highest light amounts in the Northern Hemisphere and a very strong crop.
Research seems to be confirming this, see the article: Detection of tomato brown rugose fruit virus is influenced by infection at different growth stages and sampling from different plant parts, from Anna Skelton.

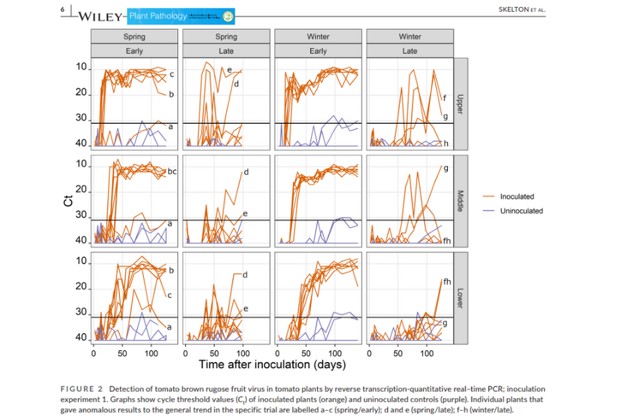
This research group followed the virus concentration in a tomato spring and winter crop and infecting the plants early (directly after planting) and late (9 weeks later). An early infection causes a very quick increase of the virus in all tested plants. However, when plants were 9 weeks older and then infected, the virus increased less strongly and was not even in all plants. The top of the plant shows the highest virus concentrations while the middle and lower parts of the plant are hardly affected.
This data shows that lower leaves most likely continue with photosynthesis and provide energy to the plant. The energy might even be enough to keep the plants in a kind of normal shape and plant growth through the end of the crop cycle. The energy balance in the plant is less disturbed and with a lot of sunlight and a strong crop, which is the case in June in the Northern Hemisphere, the plant is better able to 'handle' the virus.
Harmen Hummelen and Leonie Hogendonk 
The orange lines show the amount of virus. The higher the line means more virus. The lines start at the bottom left of every graph around a Ct of 40, and then the orange line goes up, meaning more viruses are detected, and the orange line ends on the top where the Ct value is 10.
The 3 graphs of the first column show a spring crop inoculated in a young plant stage. The virus quickly increases resulting in a steep orange line. The second column with 3 graphs shows a spring crop that 9 weeks after planting is inoculated. The virus still increases but later and not in all plants. The third column shows a winter crop with early infection, the virus increase is more or less similar to the spring crop, column 1. The last column shows a winter crop infected 9 weeks after planting. Some plants became infected, other plants did not. Also, the moment of virus increase is different for plants.
If this difference between early and late infection is indeed so pronounced it also means that preventing early infections is very important. In case the first infection, or re-infection, can be avoided or 'delayed' till 9 weeks after planting, or even longer, the virus development goes a lot slower.
Starting clean and preventing spreading, in case infection is early in some spots, can help a lot with keeping up the growth till the end of the growing cycle.
For more information:
Bayer
www.bayer.com
