How does a tomato plant uses its energy throughout the season? For the first time, the intrinsic tomato developmental changes over a full commercial crop cycle were monitored and revealed. This is done by the Swiss company Vivent, active in commercial plant electrophysiology. With long-term monitoring of electrical potential in growers located in Switzerland, France, and the Netherlands, Vivent was able to track how plant electrical activity changed between February, when seedlings were planted in the glasshouse, and October 2021, when the plants were removed. A graph shows how the electrical potential in the plant change over time.
Fitness strategy
“It’s clear that plants completely changed their activity in early Summer, and then again at the end of August”, says Carrol Plummer, CEO of Vivent, “we believe that this reflects plants switching their fitness strategy over different life stages. The large diurnal rhythms may reflect the plant’s ability to maximize energy production during the ideal summer conditions and with large leaf areas”.
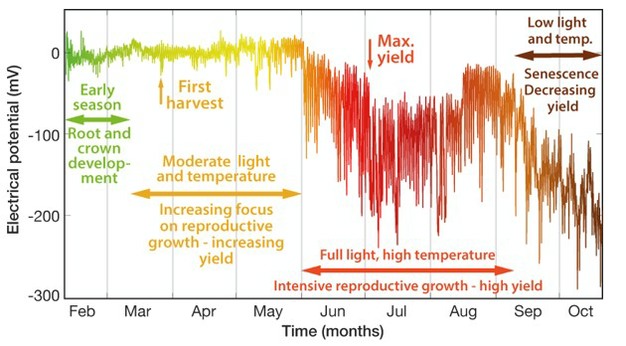
Tomato crop electrophysiological life stages.
Various phases
The first 3.5 months of relatively stable recordings reflect intensive tomato root (green phase) and crown development (yellow phase) – preparation for the intense reproductive phase in the summer. The sudden appearance of a U-shaped trend and higher amplitudes of diurnal oscillations (red phase) from June to August are characteristic of the period of highest yields and strong plant vitality. A decline of electrical potential values during the last two months (brown phase), reveals decreasing plant vitality, due to lower temperatures and limited light availability as senescence approaches. This plot is in an average of recordings taken from 8 individual plants.
Opportunities for improved yields and product quality
Carrol believes that precise, directional management of life-stage transitions supported by plant electrophysiology offers opportunities for improved yields and product quality. "We are looking forward to working with growers to explore strategies for extending the most productive period."
These long-term measurements also revealed other aspects of how plants respond to environmental stimuli, including grower interventions. For example, the ‘topping’ process towards the end of the season, designed to ensure that the plant focuses on fruit development rather than flowering, causes - against expectations - relatively little stress.
For more information:
Nigel Wallbridge (e-mail)
Vivent / PhytlSigns
www.phytlsigns.com